15Feb

The RAPID Decision Model: A Framework for Effective Decision-Making

Introduction to the RAPID Decision Model

In today’s fast-paced business environment, making quick and effective decisions is crucial for organizational success. The RAPID Decision Model, developed by Bain & Company, provides a structured framework for clarifying roles in decision-making processes. It helps organizations avoid confusion, improve accountability, and ensure that critical decisions are made efficiently.

What is the RAPID Decision Model?

The RAPID framework is an acronym that assigns key responsibilities to individuals in a decision-making process:

  • R – Recommend
  • A – Agree
  • P – Perform
  • I – Input
  • D – Decide

Each role ensures that decisions are made in a clear and accountable manner, reducing delays and conflicts.

Key Roles in the RAPID Model

1. Recommend (R)

  • The person or team responsible for proposing a course of action.
  • Conducts research, analyzes data, and prepares recommendations.
  • Typically, subject matter experts or business analysts.

2. Agree (A)

  • Individuals or groups who must agree before a decision is finalized.
  • Often includes key stakeholders or senior leadership.
  • Their approval is essential to move forward with implementation.

3. Perform (P)

  • The individuals or teams responsible for executing the decision.
  • Ensures that the decision is implemented effectively and efficiently.
  • Includes project managers, operational teams, or frontline employees.

4. Input (I)

  • Provides relevant information, data, and insights before a decision is made.
  • May include subject matter experts, legal teams, or market analysts.
  • Their role is advisory, helping to inform the decision-making process.

5. Decide (D)

  • The final decision-maker, typically a senior executive or leadership team.
  • Holds ultimate accountability for the decision.
  • Ensures alignment with organizational goals and strategies.

Benefits of Using the RAPID Decision Model

  • Clear Role Definition: Ensures accountability by assigning specific roles.
  • Faster Decision-Making: Reduces bottlenecks and confusion in the process.
  • Improved Collaboration: Encourages cross-functional teamwork and stakeholder involvement.
  • Minimized Risk: Ensures that decisions are well-informed and based on expert input.
  • Better Execution: Aligns decision-making with implementation, ensuring follow-through.

Applications of the RAPID Model

1. Corporate Strategy and Governance

  • Helps executive teams make strategic business decisions.
  • Ensures board members and stakeholders have a clear role in governance.

2. Project Management

  • Defines roles in approving and executing projects.
  • Ensures smooth collaboration between departments.

3. Operational Efficiency

  • Streamlines internal processes by clarifying decision-making responsibilities.
  • Reduces unnecessary delays caused by unclear accountability.

4. Product Development

  • Aligns teams involved in product innovation and launch decisions.
  • Ensures that market insights and technical expertise guide decision-making.

Example of the RAPID Decision Model in Action

Case Study: Implementing a New IT System

A company needs to implement a new enterprise resource planning (ERP) system. The RAPID framework is used as follows:

  • R (Recommend): The IT director recommends a new ERP system after extensive research.
  • A (Agree): The CFO and COO agree on budget and resource allocation.
  • P (Perform): The IT team and operational staff implement the system.
  • I (Input): The finance team and department heads provide insights on system requirements.
  • D (Decide): The CEO makes the final decision to proceed with the implementation.

Limitations of the RAPID Model

  • Requires Organizational Buy-In: All team members must understand and accept their roles.
  • Potential for Resistance: Employees may resist changes in decision-making authority.
  • Complex Decision Processes: May not be suitable for extremely urgent or highly dynamic situations.

Conclusion

The RAPID Decision Model is a powerful tool for improving decision-making clarity and accountability in organizations. By defining key roles, it ensures that decisions are made efficiently and executed effectively. Whether used in strategic planning, operations, or project management, the RAPID framework helps businesses streamline processes and drive better outcomes.

15Feb

The Delphi Method: A Strategic Forecasting Approach

Introduction to the Delphi Method

In strategic planning and decision-making, gaining expert insights is crucial for accuracy and reliability. The Delphi Method is a structured forecasting technique that leverages expert opinions to reach a consensus on complex issues. It is widely used in business, management, policy-making, and technology forecasting.

What is the Delphi Method?

The Delphi Method is a systematic, iterative process used to collect and refine expert opinions. Developed by the RAND Corporation in the 1950s, this technique is designed to eliminate bias and ensure informed decision-making by gathering insights from a panel of experts through multiple rounds of structured surveys.

Key Features of the Delphi Method

  1. Expert Panel: A group of subject matter experts is selected to provide insights on a specific issue.
  2. Anonymity: Participants provide opinions independently, preventing undue influence from dominant individuals.
  3. Multiple Rounds: The process involves several rounds of questionnaires to refine and converge expert opinions.
  4. Controlled Feedback: Summarized responses from previous rounds are shared to help participants adjust their views.
  5. Statistical Aggregation: Responses are analyzed quantitatively to identify trends and develop a consensus.

Steps in the Delphi Method

1. Problem Identification

Define the issue or topic that requires expert input. Establish clear objectives for the study.

2. Selecting the Expert Panel

Choose a diverse group of experts with deep knowledge and experience in the subject matter.

3. Designing and Distributing Questionnaires

  • The first round typically consists of open-ended questions to gather broad perspectives.
  • Subsequent rounds refine responses into structured, quantitative questions.

4. Collecting and Analyzing Responses

  • Responses are aggregated and analyzed to identify common themes.
  • Experts receive summarized feedback to refine their opinions in the next round.

5. Reaching a Consensus

The iterative process continues until a stable consensus is reached or diminishing returns indicate a stopping point.

Applications of the Delphi Method

1. Business & Strategic Planning

  • Forecasting market trends and consumer behavior
  • Evaluating risks and uncertainties in business decisions

2. Policy-Making & Governance

  • Developing public policies and regulatory frameworks
  • Identifying emerging societal issues

3. Technology & Innovation Management

  • Predicting future advancements in technology
  • Assessing the feasibility of new product developments

4. Healthcare & Education

  • Determining best practices for patient care
  • Improving educational curricula and methodologies

Advantages of the Delphi Method

  • Reduces Groupthink: Ensures independent thinking by preventing peer influence.
  • Encourages Expert Contributions: Allows for informed decision-making based on specialized knowledge.
  • Adaptability: Can be applied to a wide range of fields and complex issues.
  • Flexibility in Participation: Experts can provide input remotely, making it a cost-effective approach.

Limitations of the Delphi Method

  • Time-Consuming: Multiple rounds may require weeks or months to complete.
  • Dependence on Expert Selection: The quality of results relies heavily on the expertise of selected participants.
  • Potential for Participant Fatigue: Experts may lose interest if too many rounds are required.
  • Subjectivity in Interpretation: Some qualitative insights may be difficult to quantify objectively.

Real-World Example of the Delphi Method

Example: Forecasting AI Trends in Business

A tech company wants to forecast the future impact of AI on business operations. They apply the Delphi Method as follows:

  1. Expert Panel: AI specialists, business strategists, and technology analysts.
  2. Round 1: Open-ended survey on AI’s role in business over the next decade.
  3. Round 2: Experts rate the likelihood of specific AI developments based on round 1 responses.
  4. Round 3: Experts refine their ratings after reviewing aggregated feedback.
  5. Outcome: A consensus forecast on key AI-driven business transformations is reached.

Conclusion

The Delphi Method is a powerful tool for informed decision-making, leveraging expert knowledge to develop accurate forecasts. While it has limitations, its structured approach ensures reliable insights for businesses, policymakers, and researchers. By carefully selecting experts and refining opinions through multiple iterations, organizations can make data-driven strategic decisions with greater confidence.

15Feb

Cost-Benefit Analysis: A Strategic Decision-Making Tool

Introduction to Cost-Benefit Analysis

In business and project management, making informed decisions is critical to success. Cost-Benefit Analysis (CBA) is a structured approach used to evaluate the financial and qualitative impact of a decision. By comparing potential gains (benefits) against associated costs (risks), businesses can determine the feasibility and profitability of an investment or initiative.

What is Cost-Benefit Analysis?

Cost-Benefit Analysis is a systematic method of calculating and comparing the benefits and costs of a project, investment, or decision. It helps organizations assess whether the benefits outweigh the costs, ensuring that resources are allocated efficiently.

The primary objectives of CBA include:

  • Identifying all associated costs and benefits
  • Assigning a monetary value to both tangible and intangible factors
  • Comparing net benefits with total costs
  • Aiding in risk assessment and strategic decision-making

Key Components of Cost-Benefit Analysis

1. Identifying Costs

Costs in a CBA can be categorized into direct, indirect, tangible, and intangible costs:

  • Direct Costs: Expenses directly related to the project (e.g., labor, materials, equipment)
  • Indirect Costs: Overhead costs such as administrative expenses and utilities
  • Tangible Costs: Easily quantifiable costs like production and maintenance costs
  • Intangible Costs: Hard-to-measure factors like employee dissatisfaction or environmental impact

2. Identifying Benefits

Benefits include both financial and non-financial gains:

  • Revenue Growth: Increased sales or cost savings due to operational efficiencies
  • Improved Productivity: Enhanced workflow and resource utilization
  • Customer Satisfaction: Higher customer retention and brand reputation
  • Environmental and Social Impact: Sustainability benefits and corporate responsibility initiatives

3. Assigning a Monetary Value

Both costs and benefits must be quantified in monetary terms whenever possible. This involves:

  • Using historical data, industry benchmarks, or expert estimations
  • Considering future cash flows and discounting them to present value
  • Factoring in risks and uncertainties through sensitivity analysis

4. Comparing Costs and Benefits

Once all values are assigned, the following methods can be used to assess feasibility:

  • Net Present Value (NPV): Determines the present value of net benefits (benefits minus costs)
  • Benefit-Cost Ratio (BCR): Compares total benefits to total costs (BCR >1 indicates feasibility)
  • Return on Investment (ROI): Measures profitability as a percentage of costs
  • Payback Period: Estimates the time required to recover the initial investment

Steps to Conduct a Cost-Benefit Analysis

  1. Define the Scope: Clearly outline the project, decision, or investment under evaluation.
  2. List Costs and Benefits: Identify and categorize all relevant factors.
  3. Quantify Costs and Benefits: Assign numerical values to tangible and intangible elements.
  4. Apply Discounting (if applicable): Adjust future cash flows to present values.
  5. Compare and Interpret Results: Use financial metrics (NPV, ROI, BCR) to assess feasibility.
  6. Make an Informed Decision: Choose the option that maximizes net benefits.
  7. Monitor and Evaluate: Track actual outcomes against initial estimates for continuous improvement.

Advantages of Cost-Benefit Analysis

  • Objective Decision-Making: Provides a data-driven approach for evaluating alternatives.
  • Resource Optimization: Ensures efficient allocation of resources.
  • Risk Assessment: Identifies potential risks and uncertainties.
  • Improved Transparency: Helps stakeholders understand the rationale behind decisions.

Limitations of Cost-Benefit Analysis

  • Difficulty in Quantifying Intangible Factors: Some benefits (e.g., employee morale, brand equity) are hard to measure.
  • Assumption-Based Predictions: Future costs and benefits may not always align with real-world scenarios.
  • Time-Consuming: Complex projects require extensive data collection and analysis.
  • Potential Bias: Over- or underestimating costs and benefits can impact decision accuracy.

Real-World Example of Cost-Benefit Analysis

Example 1: Implementing Automation in Manufacturing

  • Costs: $500,000 initial investment, $50,000 annual maintenance
  • Benefits: $200,000 annual savings from reduced labor costs, $30,000 in increased efficiency gains
  • Analysis:
    • NPV Calculation: $1.5 million (discounted benefits) – $500,000 (initial cost) = $1 million net gain
    • BCR: 1.8 (indicating a viable investment)
    • ROI: 100% within five years
  • Decision: Proceed with automation to improve productivity and reduce costs.

Example 2: Launching a New Product Line

  • Costs: $300,000 for R&D, marketing, and production
  • Benefits: Estimated revenue of $150,000 per year
  • Analysis:
    • Payback Period: 2 years
    • ROI: 50% over four years
  • Decision: If the company can sustain the initial investment, the project is worthwhile.

Conclusion

Cost-Benefit Analysis is an essential tool for businesses to evaluate investment decisions, projects, and policy changes. By systematically comparing costs and benefits, organizations can ensure that their strategies lead to maximum profitability and sustainability. Despite its limitations, CBA remains a valuable method for making data-driven decisions in both private and public sectors.

15Feb

Key Performance Indicators (KPIs): Measuring Business Success

Introduction to Key Performance Indicators (KPIs)

In today’s competitive business environment, tracking performance is essential for achieving success. Key Performance Indicators (KPIs) are measurable values that help organizations evaluate their progress toward specific goals. By analyzing KPIs, businesses can improve decision-making, enhance efficiency, and drive growth.

What Are KPIs?

KPIs are quantifiable metrics used to assess an organization’s performance over time. They help companies monitor progress, identify areas of improvement, and align strategies with business objectives. Effective KPIs are SMART—Specific, Measurable, Achievable, Relevant, and Time-bound.

Types of Key Performance Indicators

1. Financial KPIs

Financial metrics help organizations assess profitability, stability, and overall financial health. Common financial KPIs include:

  • Revenue Growth Rate: Measures the increase in company revenue over a specific period.
  • Gross Profit Margin: Indicates profitability by measuring the percentage of revenue remaining after deducting the cost of goods sold.
  • Return on Investment (ROI): Evaluates the efficiency of investments in generating profits.
  • Operating Cash Flow: Assesses the cash generated by core business operations.

2. Customer KPIs

Customer-focused KPIs measure customer satisfaction, retention, and engagement. Key metrics include:

  • Customer Satisfaction Score (CSAT): Reflects customer satisfaction levels through surveys and feedback.
  • Net Promoter Score (NPS): Measures customer loyalty based on their likelihood to recommend a company.
  • Customer Retention Rate: Evaluates the percentage of returning customers over a given period.
  • Customer Lifetime Value (CLV): Estimates the total revenue a business can generate from a single customer over time.

3. Operational KPIs

Operational KPIs track the efficiency and effectiveness of business processes. Key operational metrics include:

  • Employee Productivity: Measures output per employee in relation to set business goals.
  • Order Fulfillment Time: Assesses the time taken from order placement to delivery.
  • Inventory Turnover Ratio: Tracks how frequently inventory is sold and replaced within a specific period.
  • First Call Resolution (FCR): Evaluates the efficiency of customer service by measuring issue resolution in the first interaction.

4. Marketing KPIs

Marketing KPIs assess the effectiveness of promotional efforts and digital marketing strategies. Common metrics include:

  • Conversion Rate: Measures the percentage of website visitors who complete a desired action (e.g., purchase, signup).
  • Customer Acquisition Cost (CAC): Determines the total cost of acquiring a new customer.
  • Social Media Engagement: Tracks likes, shares, comments, and overall interaction on social platforms.
  • Return on Marketing Investment (ROMI): Evaluates the effectiveness of marketing campaigns in generating revenue.

5. Employee KPIs

Employee-related KPIs measure workforce performance, engagement, and satisfaction. These include:

  • Employee Turnover Rate: Assesses the percentage of employees leaving the company within a specific period.
  • Training Effectiveness: Evaluates the impact of employee training programs on skill enhancement.
  • Absenteeism Rate: Measures the frequency of employee absences over time.
  • Employee Engagement Score: Gauges overall employee morale and motivation.

Importance of KPIs in Business Management

KPIs play a crucial role in business management by:

  • Providing Measurable Insights: Helps track progress and ensure alignment with business objectives.
  • Enhancing Decision-Making: Supports data-driven decisions based on real-time performance metrics.
  • Identifying Strengths and Weaknesses: Highlights areas requiring improvement to optimize business processes.
  • Boosting Accountability: Encourages teams to stay focused on their goals and performance expectations.
  • Driving Continuous Improvement: Ensures organizations adapt to market changes and maintain competitive advantage.

How to Choose the Right KPIs

Selecting the right KPIs involves:

  1. Aligning with Business Goals: Ensure KPIs reflect the company’s overall mission and objectives.
  2. Keeping KPIs Relevant: Choose metrics that directly impact business success.
  3. Ensuring Data Availability: Select KPIs that can be measured accurately and consistently.
  4. Setting Realistic Targets: Establish achievable performance benchmarks.
  5. Regularly Reviewing KPIs: Continuously track and update KPIs based on market trends and business needs.

Real-World Example of KPI Application

Example 1: E-commerce Business

  • Revenue Growth Rate: +15% YoY increase in sales
  • Customer Acquisition Cost (CAC): $25 per new customer
  • Cart Abandonment Rate: 40% (goal: reduce to 30%)
  • Average Order Value (AOV): $75 per transaction

Example 2: SaaS Company

  • Monthly Recurring Revenue (MRR): $100,000
  • Churn Rate: 5% (goal: reduce to 3%)
  • Net Promoter Score (NPS): 80 (indicating high customer loyalty)
  • Customer Support Response Time: <5 minutes

Conclusion

Key Performance Indicators (KPIs) are essential tools for measuring business success. By tracking financial, operational, customer, marketing, and employee-related KPIs, organizations can make informed decisions, optimize performance, and achieve sustainable growth. Understanding and implementing effective KPIs empowers businesses to stay competitive in an ever-evolving market landscape.

15Feb

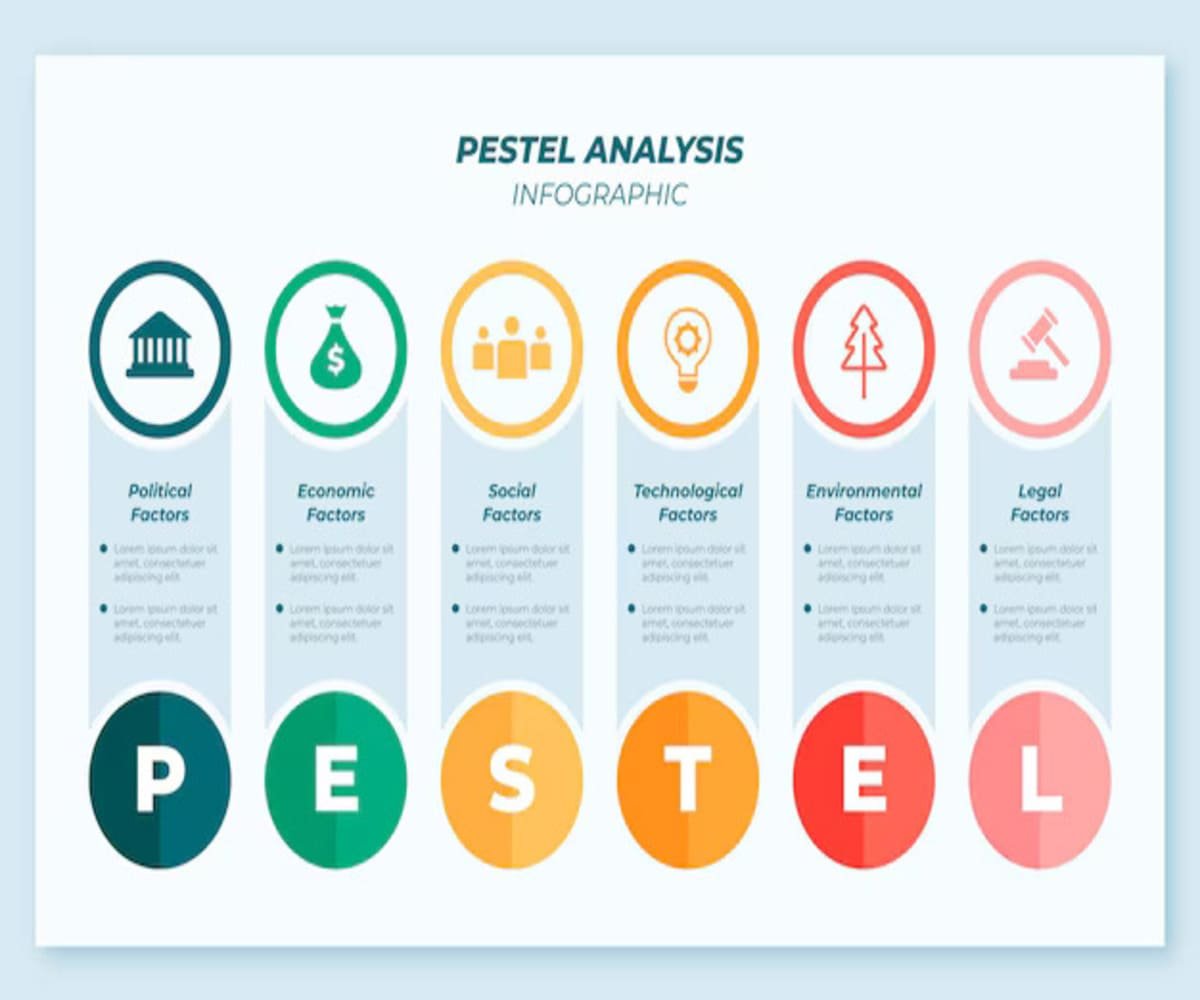
PESTEL Analysis: A Strategic Framework for Business Success

Introduction to PESTEL Analysis

In the modern business environment, external factors significantly impact an organization’s success. PESTEL Analysis is a crucial strategic tool that helps businesses understand macro-environmental factors affecting their operations. This framework evaluates Political, Economic, Social, Technological, Environmental, and Legal aspects to make informed business decisions and anticipate future trends.

Understanding PESTEL Analysis

PESTEL Analysis examines six major external factors that influence an organization’s strategic planning and market positioning. By analyzing these elements, businesses can identify opportunities and threats in their industry and adapt their strategies accordingly.

Components of PESTEL Analysis

1. Political Factors

Political factors refer to government policies, regulations, and stability that impact business operations. Key elements include:

  • Tax policies and trade tariffs
  • Political stability and government regulations
  • Labor laws and employment policies
  • International trade agreements
  • Corruption levels and lobbying influences

2. Economic Factors

Economic factors determine the overall financial health and purchasing power within a market. These include:

  • Inflation and interest rates
  • Exchange rate fluctuations
  • Economic growth trends
  • Consumer spending behavior
  • Market demand and supply dynamics

3. Social Factors

Social factors encompass societal trends, demographics, and cultural influences that shape consumer behavior. Key considerations include:

  • Population demographics (age, gender, income levels)
  • Cultural attitudes and lifestyle trends
  • Consumer behavior and buying patterns
  • Education and employment rates
  • Social media and influencer marketing impact

4. Technological Factors

Technological advancements drive innovation and competitiveness within industries. Important aspects to analyze include:

  • Emerging technologies (AI, automation, blockchain)
  • Digital transformation and innovation
  • R&D investments and technological infrastructure
  • Cybersecurity and data protection
  • Mobile and internet penetration

5. Environmental Factors

Environmental factors focus on ecological and sustainability concerns affecting businesses. Key elements include:

  • Climate change impact and sustainability initiatives
  • Renewable energy adoption
  • Environmental regulations and policies
  • Waste management and recycling programs
  • Corporate social responsibility (CSR) efforts

6. Legal Factors

Legal factors involve regulations and laws that govern business operations and industry compliance. These include:

  • Consumer protection laws
  • Employment and labor regulations
  • Intellectual property rights
  • Health and safety standards
  • Competition laws and antitrust regulations

Importance of PESTEL Analysis in Management

PESTEL Analysis is widely used in management courses and business strategies for the following reasons:

  • Enhances Risk Assessment: Identifies external risks that may impact business operations.
  • Informs Strategic Planning: Helps businesses align their strategies with external market conditions.
  • Encourages Proactive Decision-Making: Enables organizations to anticipate and prepare for potential challenges.
  • Improves Competitive Advantage: Assists in identifying opportunities to gain an edge over competitors.

Steps to Conduct a PESTEL Analysis

  1. Define the Scope: Determine the objective and focus of the analysis (industry, company, or market).
  2. Gather Data: Research relevant external factors through reports, market studies, and expert insights.
  3. Analyze Each Factor: Evaluate how political, economic, social, technological, environmental, and legal aspects affect the business.
  4. Identify Opportunities & Threats: Categorize insights to develop strategic responses.
  5. Implement Findings: Apply the analysis to decision-making and strategic planning.
  6. Monitor & Update: Regularly review PESTEL analysis to adapt to changing external conditions.

Real-World Examples of PESTEL Analysis

Example 1: Tesla, Inc.

  • Political: Government incentives for electric vehicles, environmental regulations
  • Economic: Rising raw material costs, fluctuating market demand
  • Social: Growing demand for sustainable transport, changing consumer preferences
  • Technological: Advancements in battery technology, AI-driven automation
  • Environmental: Carbon footprint reduction initiatives, renewable energy adoption
  • Legal: Patent laws and intellectual property protection, safety regulations

Example 2: Fast Food Industry

  • Political: Food safety regulations, government policies on nutrition
  • Economic: Rising food costs, consumer purchasing power
  • Social: Increasing demand for healthier fast food options
  • Technological: Use of AI in supply chain management, online ordering trends
  • Environmental: Sustainable packaging initiatives, waste management practices
  • Legal: Compliance with hygiene laws, employee labor rights

Conclusion

PESTEL Analysis is a fundamental tool for businesses and management professionals to understand external factors shaping their industry. By evaluating Political, Economic, Social, Technological, Environmental, and Legal influences, companies can develop resilient strategies, mitigate risks, and seize new opportunities. For management students, mastering PESTEL Analysis is essential for making data-driven decisions and becoming effective business leaders in a dynamic market environment.

15Feb

SWOT Analysis: A Strategic Tool for Business & Management Success

Introduction to SWOT Analysis

In the dynamic world of business and management, decision-making plays a crucial role in determining success. One of the most effective strategic planning tools used by organizations and professionals is SWOT Analysis. This method helps in identifying and evaluating key internal and external factors that influence a business, allowing for better decision-making and strategy formulation.

What is SWOT Analysis?

SWOT Analysis is a structured planning tool used to assess Strengths, Weaknesses, Opportunities, and Threats related to a business, project, or any strategic initiative. This analysis helps businesses and professionals to:

  • Identify core competencies and areas of improvement
  • Leverage external opportunities
  • Mitigate potential risks
  • Formulate strategic business decisions

Key Components of SWOT Analysis

1. Strengths

Strengths are the internal attributes that give an organization a competitive advantage. These can include:

  • Strong brand recognition
  • Skilled workforce
  • Unique product offerings
  • Advanced technology
  • Strong financial position

2. Weaknesses

Weaknesses are internal factors that can hinder an organization’s growth and success. Identifying these areas helps in addressing gaps and improving overall efficiency. Examples include:

  • Lack of brand awareness
  • Poor financial management
  • Limited market reach
  • Outdated technology
  • Inefficient supply chain

3. Opportunities

Opportunities are external factors that organizations can leverage to grow and gain a competitive edge. These include:

  • Market expansion
  • Technological advancements
  • Changing consumer preferences
  • Government incentives
  • Strategic partnerships

4. Threats

Threats are external challenges that can negatively impact a business. Recognizing these risks allows businesses to develop proactive strategies to mitigate them. Common threats include:

  • Intense market competition
  • Economic downturns
  • Regulatory changes
  • Rapid technological shifts
  • Negative brand perception

Why Important in Management Courses?

SWOT Analysis is widely used in management education to train future business leaders and decision-makers. It provides valuable insights into business strategy, risk management, and competitive analysis. Here’s why it is crucial for management students:

  • Enhances Critical Thinking: Encourages students to analyze and evaluate business scenarios effectively.
  • Strategic Planning Skills: Helps in developing long-term business strategies based on internal and external factors.
  • Improves Decision-Making: Enables students to make informed business decisions by identifying key areas of focus.
  • Practical Application: SWOT Analysis is applicable across various industries, making it a versatile learning tool.

Steps to Conduct a SWOT Analysis

Performing an effective SWOT Analysis involves a systematic approach. Here’s a step-by-step guide:

  1. Identify Objectives: Define the purpose of the analysis, whether for a business, product launch, or career development.
  2. Gather Data: Collect relevant information through market research, surveys, and industry reports.
  3. List Strengths and Weaknesses: Assess internal capabilities and areas for improvement.
  4. Identify Opportunities and Threats: Analyze external factors that may impact the business.
  5. Develop Strategies: Use insights to formulate actionable strategies for growth and risk management.
  6. Review and Update: Continuously reassess SWOT factors to stay relevant in a dynamic business environment.

Real-World Examples of SWOT Analysis

Example 1: Apple Inc.

  • Strengths: Strong brand loyalty, innovation, global market presence
  • Weaknesses: High product prices, dependence on iPhone sales
  • Opportunities: Expansion in emerging markets, AI and VR technologies
  • Threats: Intense competition, global supply chain issues

Example 2: A Startup Business

  • Strengths: Innovative product, flexible operations, strong team
  • Weaknesses: Limited funding, lack of brand recognition
  • Opportunities: Growing market demand, potential investor funding
  • Threats: Industry regulations, established competitors

Conclusion

SWOT Analysis is a fundamental tool in strategic management and business decision-making. By identifying strengths, weaknesses, opportunities, and threats, businesses and professionals can develop effective strategies to achieve success. For management students, mastering SWOT Analysis is essential to understanding business dynamics and becoming effective leaders in the corporate world.

Embracing SWOT Analysis ensures businesses remain competitive, adaptable, and resilient in an ever-changing market landscape.

14Feb

Integrating SEO & SEM into Business Strategy

Integrating Search Engine Optimization (SEO) and Search Engine Marketing (SEM) into a business strategy is essential for maximizing online visibility, driving traffic, and improving conversions. By combining organic and paid search tactics, businesses can create a comprehensive digital marketing approach that enhances long-term growth and immediate results.

1. Understanding SEO & SEM

A. What is SEO?

Search Engine Optimization (SEO) focuses on improving organic search rankings through content optimization, technical improvements, and authoritative backlinks. SEO is a long-term strategy that enhances brand credibility and visibility.

B. What is SEM?

Search Engine Marketing (SEM) involves paid advertising strategies, such as Google Ads and Pay-Per-Click (PPC) campaigns, to drive targeted traffic instantly. SEM delivers faster results and is useful for competitive keywords and seasonal promotions.

2. Benefits of Integrating SEO & SEM

  • Increases Overall Search Visibility: Combining organic and paid search strategies maximizes SERP (Search Engine Results Page) presence.
  • Balances Short-Term & Long-Term Growth: SEM drives immediate traffic while SEO builds long-term credibility.
  • Optimizes Marketing Budgets: A well-balanced approach ensures efficient use of marketing spend.
  • Enhances Data-Driven Decision Making: Insights from SEM campaigns help refine SEO strategies.

3. Key Strategies for SEO & SEM Integration

A. Keyword Research Alignment

  • Conduct thorough keyword research for both organic and paid search.
  • Use high-performing PPC keywords to optimize SEO content.
  • Leverage long-tail keywords to improve both SEO and SEM efficiency.

B. Content Optimization & PPC Synergy

  • Create high-quality content targeting valuable keywords.
  • Use PPC ads to promote top-performing organic content.
  • Implement A/B testing on ad copies and landing pages to enhance SEO conversion rates.

C. Optimizing Landing Pages

  • Design landing pages that align with both organic search intent and paid campaigns.
  • Ensure fast load times, mobile optimization, and clear CTAs.
  • Utilize retargeting strategies to capture leads who visited the site via SEO or SEM.

D. Link Building & Paid Advertising Integration

  • Use PPC campaigns to boost content visibility and earn natural backlinks.
  • Promote content through Google Ads and social media advertising.
  • Leverage paid search data to refine link-building outreach efforts.

E. Tracking & Performance Measurement

  • Use Google Analytics and Google Search Console to analyze SEO performance.
  • Monitor SEM campaign metrics, such as CTR, Quality Score, and ROI.
  • Adjust strategies based on data insights to improve overall search effectiveness.

4. Common Challenges & Solutions

A. Balancing Budget Allocation

  • Prioritize high-value, competitive keywords for SEM while growing organic rankings.
  • Allocate budget based on performance data and business objectives.

B. Managing Keyword Cannibalization

  • Avoid competing with your own SEO pages in paid search campaigns.
  • Use negative keywords to refine SEM targeting.

C. Maintaining Consistency Across Channels

  • Ensure messaging alignment between organic content and paid ads.
  • Use unified branding across SEO and SEM efforts.

5. Final Thoughts

Integrating SEO and SEM into your business strategy creates a powerful digital marketing ecosystem that drives sustainable growth. By leveraging both organic and paid search tactics, businesses can maximize reach, improve conversions, and stay ahead of the competition.

Want to master SEO & SEM integration? Enroll in our Comprehensive Digital Marketing Strategy Course today!

14Feb

Analytics & Performance Optimization

Analytics and performance optimization

Analytics and performance optimization are crucial for businesses looking to measure, analyze, and enhance their digital marketing efforts. By leveraging data-driven insights, businesses can improve their strategies, optimize website performance, and increase conversions.

1. Understanding Web Analytics

Web analytics involves tracking and analyzing user behavior on a website to gain insights into traffic, engagement, and conversions. These insights help businesses refine their digital marketing efforts and improve user experience.

Key Benefits of Web Analytics:

  • Identifies user behavior and trends.
  • Measures the effectiveness of marketing campaigns.
  • Optimizes website performance for better user experience.
  • Helps improve conversion rates and ROI.

2. Essential Web Analytics Tools

A. Google Analytics

  • Tracks website traffic, user behavior, and conversions.
  • Provides insights into audience demographics and interests.
  • Offers detailed reports on acquisition, engagement, and retention.

B. Google Search Console

  • Monitors website performance in Google search results.
  • Identifies indexing issues and keyword rankings.
  • Provides insights into search queries and click-through rates.

C. Heatmap & Session Recording Tools (e.g., Hotjar, Crazy Egg)

  • Visualizes user interactions and click patterns.
  • Identifies areas of user frustration and drop-offs.

D. Conversion Rate Optimization (CRO) Tools

  • A/B testing tools like Google Optimize and Optimizely.
  • Funnel analysis to identify friction points.

3. Key Metrics to Monitor

A. Traffic & User Engagement Metrics

  • Pageviews: Number of pages viewed by users.
  • Bounce Rate: Percentage of visitors who leave without interaction.
  • Session Duration: Average time users spend on the site.

B. Acquisition Metrics

  • Traffic Sources: Organic, paid, social, and referral traffic.
  • Click-Through Rate (CTR): Percentage of users clicking on ads or links.
  • Keyword Rankings: Positioning in search engine results.

C. Conversion Metrics

  • Conversion Rate: Percentage of users completing desired actions.
  • Cart Abandonment Rate: Percentage of users abandoning checkout.
  • Customer Lifetime Value (CLV): Revenue potential of a customer over time.

4. Performance Optimization Strategies

A. Website Speed Optimization

  • Use tools like Google PageSpeed Insights to identify speed issues.
  • Optimize images, enable caching, and minify CSS/JavaScript.
  • Use a Content Delivery Network (CDN) for faster load times.

B. Mobile Optimization

  • Ensure mobile responsiveness and fast loading times.
  • Optimize navigation and UX for mobile users.

C. SEO & Content Optimization

  • Use keyword research to enhance content relevance.
  • Optimize metadata, headers, and alt text for better indexing.

D. A/B Testing & Experimentation

  • Test different variations of landing pages and CTAs.
  • Use heatmaps and user feedback to refine user experience.

5. Tracking & Continuous Improvement

A. Setting Up Goals & Funnels

  • Define key performance indicators (KPIs) aligned with business objectives.
  • Create conversion funnels to track user progression.

B. Regular Performance Audits

  • Conduct periodic reviews using analytics tools.
  • Identify and fix performance bottlenecks.

C. Data-Driven Decision Making

  • Use analytics insights to adjust marketing strategies.
  • Optimize campaigns based on data trends and user behavior.

Final Thoughts

Analytics and performance optimization are essential for achieving digital marketing success. By leveraging data insights, refining strategies, and continuously testing improvements, businesses can enhance user experience, boost conversions, and maximize ROI.

Want to master analytics and optimization? Enroll in our Advanced Digital Analytics & Performance Optimization Course today!

14Feb

Local SEO & Google My Business Optimization

Local SEO (Search Engine Optimization) and Google My Business (GMB) optimization are essential for businesses looking to attract customers within a specific geographic area. By improving local search visibility, businesses can enhance their online presence, drive foot traffic, and generate more leads from local searches.

1. Understanding Local SEO

Local SEO focuses on optimizing a business’s online presence to appear in local search results. It helps businesses connect with nearby customers searching for products or services.

Key Benefits of Local SEO:

  • Increases visibility in local search results.
  • Drives targeted traffic to physical stores and websites.
  • Improves trust and credibility through customer reviews.
  • Enhances mobile search performance.

2. Google My Business (GMB) Optimization

Google My Business is a free tool that allows businesses to manage their online presence across Google Search and Maps. Optimizing your GMB profile ensures your business appears in relevant local searches.

Steps to Optimize Your GMB Profile:

A. Claim and Verify Your Business

  • Visit Google My Business and claim your listing.
  • Complete the verification process via mail, phone, or email.

B. Complete Your Business Information

  • Add accurate business details (name, address, phone number, website, business hours, etc.).
  • Choose the correct business category and attributes.

C. Upload High-Quality Photos & Videos

  • Add images of your storefront, products, and team.
  • Include videos showcasing services or customer testimonials.

D. Encourage & Respond to Reviews

  • Request satisfied customers to leave positive reviews.
  • Respond to all reviews promptly, thanking customers or addressing concerns.

E. Utilize GMB Posts & Updates

  • Share business updates, promotions, events, and blog posts.
  • Use engaging visuals and compelling CTAs (Call-to-Actions).

F. Enable Messaging & Q&A

  • Turn on direct messaging for customer inquiries.
  • Monitor and answer customer questions to build trust.

3. Local SEO Strategies for Higher Rankings

A. Optimize Website for Local Keywords

  • Conduct keyword research for location-based search terms.
  • Use keywords naturally in titles, meta descriptions, and content.

B. Build Local Citations & Listings

  • Ensure your business is listed in directories like Yelp, Yellow Pages, and Bing Places.
  • Maintain NAP (Name, Address, Phone) consistency across platforms.

C. Create Locally Relevant Content

  • Publish blog posts about local events, news, and industry trends.
  • Use location-specific keywords and customer testimonials.

D. Earn Backlinks from Local Sources

  • Partner with local bloggers, news sites, and business directories.
  • Participate in local sponsorships and community events.

E. Optimize for Mobile & Voice Search

  • Ensure your website is mobile-friendly and loads quickly.
  • Optimize for voice search queries like “best coffee shop near me.”

4. Tracking & Measuring Local SEO Success

Key Metrics to Monitor:

  • Google My Business Insights: Track profile views, clicks, and actions.
  • Local Search Rankings: Monitor keyword positions in local search results.
  • Website Traffic & Conversion Rates: Use Google Analytics to assess local visitor engagement.
  • Customer Reviews & Ratings: Measure brand reputation and credibility.

Final Thoughts

Local SEO and Google My Business optimization are crucial for businesses targeting local customers. By implementing strategic optimizations, engaging with customers, and tracking performance, businesses can enhance their local online presence and attract more leads.

Want to dominate local search? Enroll in our Local SEO & Google My Business Mastery Course today!

14Feb

Remarketing & Display Advertising

Remarketing and display advertising are essential strategies for businesses looking to enhance brand awareness, re-engage potential customers, and increase conversion rates. By targeting users who have already interacted with your website or ads, remarketing ensures your brand stays top-of-mind, while display advertising broadens your reach across various digital platforms.

1. Understanding Remarketing & Display Advertising

What is Remarketing?

Remarketing is a digital advertising strategy that targets users who have previously visited your website, engaged with your content, or interacted with your brand. It helps bring back potential customers and encourages them to complete desired actions, such as making a purchase or signing up for a service.

What is Display Advertising?

Display advertising involves placing visual banner ads on various websites, apps, and social media platforms. These ads use images, videos, and interactive elements to attract users and increase brand visibility.

2. Benefits of Remarketing & Display Advertising

  • Increases Brand Awareness: Keeps your brand visible to potential customers.
  • Improves Conversion Rates: Targets warm leads who are more likely to convert.
  • Cost-Effective Marketing: Uses lower CPC (Cost-Per-Click) compared to search ads.
  • Highly Targeted Audience Reach: Shows ads based on user behavior and interests.
  • Supports Multi-Touchpoint Customer Journeys: Engages users at different stages of the sales funnel.

3. Key Remarketing Strategies

A. Website Remarketing

  • Targets visitors who have viewed specific pages or abandoned their cart.
  • Uses tailored ad messaging to encourage return visits.

B. Email Remarketing

  • Retargets users who have engaged with emails but haven’t converted.
  • Sends personalized follow-up emails with offers or reminders.

C. Video Remarketing

  • Displays ads to users who have watched your YouTube videos.
  • Uses engaging video content to increase conversions.

D. Social Media Remarketing

  • Shows ads to users who interacted with your brand on Facebook, Instagram, LinkedIn, or Twitter.
  • Creates lookalike audiences to expand reach to similar users.

4. Effective Display Advertising Strategies

A. Audience Targeting

  • Demographic Targeting: Reaches users based on age, gender, income, etc.
  • Interest-Based Targeting: Displays ads based on users’ online behavior.
  • Contextual Targeting: Places ads on relevant websites related to your industry.

B. Ad Formats & Creative Best Practices

  • Banner Ads: Use compelling visuals and clear CTAs.
  • Video Ads: Engage users with short, impactful content.
  • Responsive Ads: Automatically adjust size, format, and appearance based on placement.

C. Retargeting with Dynamic Ads

  • Uses personalized ads showing products or services users previously viewed.
  • Enhances engagement by reminding users of items left in their cart.

5. Measuring & Optimizing Campaign Performance

Key Metrics to Track:

  • Click-Through Rate (CTR): Measures user engagement with ads.
  • Conversion Rate: Evaluates how many users complete desired actions.
  • Cost-Per-Click (CPC) & Return on Ad Spend (ROAS): Analyzes budget efficiency.
  • Bounce Rate & Time on Site: Assesses ad impact on user behavior.

Optimization Tips:

  • A/B test different ad creatives and messaging.
  • Refine audience segmentation for better targeting.
  • Adjust bidding strategies based on campaign performance.

Final Thoughts

Remarketing and display advertising are powerful tools for reinforcing brand engagement, improving conversions, and maintaining a strong online presence. By implementing strategic targeting, creative ad designs, and performance optimizations, businesses can maximize their advertising ROI.

Want to master remarketing and display advertising? Enroll in our Advanced Digital Advertising Course to elevate your marketing skills and drive better results!